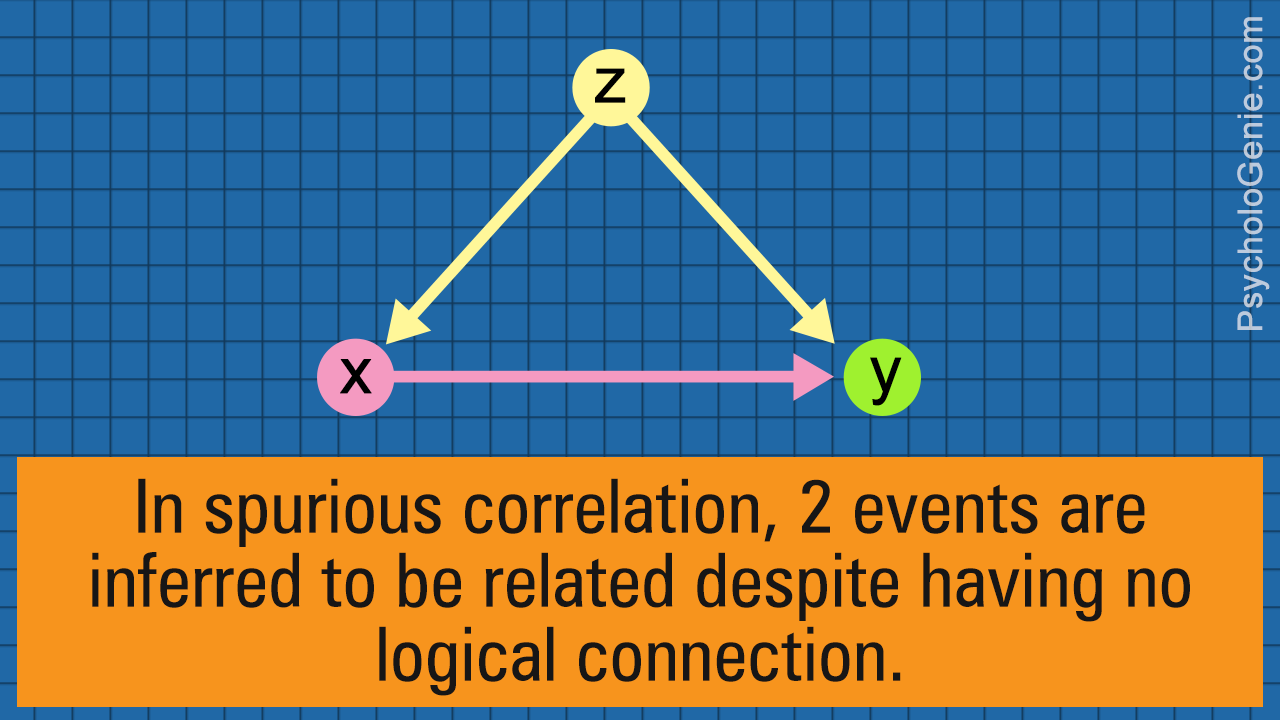
A spurious correlation is a relationship wherein two events/variables that actually have no logical connection are inferred to be related due an unseen third occurrence. This PsycholoGenie article explains spurious correlation with examples.
The word ‘spurious’ has a Latin root; it means ‘false’ or ‘illegitimate’.
A correlation is a kind of association between two variables or events. Extensively used in theoretical and analytical disciplines, like mathematics, statistics, psychology, sociology, etc., correlation is very important in order to understand the relationships between variables in a small group so that the results can be generalized for a larger group.
By definition, two variables or instances are said to be spuriously correlated if it is assumed that they are related to each other, which is of course, not true, since an unseen third variable or event turns out to be the actual causal factor. The paragraphs below explain this concept in detail with examples.
- The general observation that leads to a false assumption about the relationship between variables is the fact that one changes along with the other.
- It is assumed that since variable B increased/decreased as variable A increased/decreased, they are related to each other. The actual cause is a third variable C, that brought about a change in both the other variables.
- The fact that A and B simultaneously underwent change is just a coincidence, and what throws observers off-track is that C is ‘unseen’ or ‘lurking’.
- For instance, consider that a particular survey reveals a relation between the homeless population and crime rate.
- Technically, there is no direct connection between the two variables. However, a third, lurking variable, like unemployment or alcohol abuse, may be a causal factor for both these situations.
- That is, we cannot state that ‘the increase in the homeless population is due to the increasing crime rate’ or vice-versa. The causal factor here may be unemployment, due to which people are either homeless, or they resort to crimes, or both.
- You will understand the theory better with the list of examples presented below.
Back to Top
Examples
◼Example I
Consider a relation between two events at a party. Let’s say, the students who danced the most were the ones who threw up. The assumption is that dancing caused them to throw up, or vice-versa (yeah, it sounds gross). But the unseen variable here is drinking excess alcohol, which causes one to throw up as well as dance like a maniac.
◼Example II
A student notices that on the days she is too lazy to wake up and get ready for college, are the days when there are road accidents. Of course, there is no correlation. The reason here is probably the morose weather, which causes her to become lethargic, and also cause road accidents.
◼Example III
Another example would be of student athletes and their female fan following. The general assumption is that females are attracted to these students because they are athletes. There is no such correlation though, the fact is that athletes have muscular bodies (the third variable), females are attracted to their strong personality, and hence the misconception.
◼Example IV
A general connection is assumed between the price of alcohol and the high salaries of government officials; however, there is no relationship here. The fact is, politicians and political parties generally reside in urban areas, and salaries and costs tend to be higher in the cities.
◼Example V
A general observer finds that an increase in population in tourist towns leads to increase in the rate of thefts and robbery. There is no correlation between excess population and the crime rate though, the fact is, when more tourists arrive, the population naturally increases, and tourists fall victims to petty crimes like theft by the local public, hence the correlation.
◼Example VI
Let’s say, a student assumes that there is a correlation between the preparation time for exams and the quality of the answers written. This correlation may very well be spurious, for there is no evidence that the more you prepare, the better your answer your tests. It is just a generalization. After all, if students are smart enough, they write better answers even little practice. The unseen variable here is where the student prepares. If the students prepare together in the house, they are bound to get distracted easily and will hamper their preparation. They will also focus and concentrate less on the subject, which leads to poor grades. On the contrary, when they prepare in a quiet environment, like the library, they tend to concentrate better, and so, they write their paper better.
◼Example I
A connection is assumed to exist between the sizes of both the left hand and the right hand. No such connection exists; the size of the hands depend on genes.
◼Example II
Consider a hypothetical situation where students assume that there is a correlation between grades and their hair length. The assumption here is that longer the hair, higher the scores. However, the lurking factor here may be that female students got better, may be because they worked harder and more sincerely than the guys. Or perhaps, they were seniors who already had some experience due to which they fared better.
◼Example III
This is a rather commonly-assumed spurious relationship about the shoe size of children and their reading ability. People assume that the more they read, they outgrow their shoes, or their shoes don’t fit them as they read better. How wrong, how wrong. The very obvious factor here is age. As they grow bigger, they tend to develop their reading ability. Along with mental skills, their bodies undergo a change as well, and their feet grow bigger, which is why they outgrow their shoes.
◼Example IV
A ridiculous assumption is that obese children are clumsy or vice versa. Truth be told, it is the fact that eating excessively causes them to be lethargic and lazy, which is why they are not into sports and other activities, which makes them clumsy and obese.
◼Example V
Another ridiculous assumption on similar grounds is that ‘safety makes kids fat’. The safety factor here is the security measures for public and private grounds and parks. The connection assumed here is that the more safety measures in place, the fatter the kids get. The actual reason is that extra safety and security spoils the fun of sports and games for the kids, which is why they avoid playing at all, and the lack of exercise causes them to gain weight.
◼Example VI
Research had once unearthed a correlation between menopause and the increased risk of cardiovascular disease, for which medical experts had suggested menopausal hormone therapy, declaring that it would lower women’s risk of diseases. This connection turned out to be completely false, when subsequent research discovered that taking HT increased the risk of heart diseases and other disorders.
There have been innumerable instances of spurious correlations in the news. Some of the prominent ones are highlighted here. Here, we have not mentioned the real causal factor since it has not yet been established or found out.
◼Example I
Root canal or consuming milk is related to cancer.
◼Example II
Drowning and dying in swimming pools is related to watching the movies of Nicholas Cage.
◼Example III
Bullying is related to a reduced risk of chronic diseases.
◼Example IV
Consumption of cheese in the US is related to people dying by getting tangled in their bed sheets.
◼Example V
The expenditure of US on science and technology is related to the suicide rate by hanging.
◼ Example VI
The divorce rate in Maine is related to the consumption of margarine.
◼ Example I
The skirt length theory is one of the most iconic and important spurious correlations in history. There was a general belief that shorter the lengths of the skirts worn by women, better the stock market trends. What is the connection, if I may ask? Absolutely nothing. Astoundingly though, this correlation tends to be true 25% of the time. The causal factor here may be the fact that back in the earlier days, shorter skirts signified loose values, due to which investors dedicated all their time to improving their market share.
◼Example II
Another trend observed has been the correlation between ice-cream sales and the number of deaths by drowning. The third factor here may be the weather―people tend to have more ice cream during the summer months, and also prefer to go for a swim accounting to the warm weather, which may lead to drowning if proper care is not taken.
◼Example III
A relationship is assumed to exist between the heights of boys and girls. But the only connection here is nothing else but genetics.
◼Example IV
A general trend was observed between the number of crimes and the number of police officers. The unseen factor was the area―a highly populated area has more police officers due to the number of people. More population also gives rise to more crimes.
◼Example V
This has to one of the most ridiculous spurious correlations ever. The connection was made between the population of a town in Germany, called Oldenburg, and the number of storks sighted in the town over more than half a decade. Whatever is the connection? The only explanation is the fact that the population of the town and the birds were increasing simultaneously.
◼Example VI
Another example of time being a causal factor was reflected in the correlation once made between the cost of alcohol and the salaries of teachers. Fact is, both increase as the years roll by; there is no direct connection.
By all means, a spurious relationship cannot be used in order to find the causative factors, due to the contradiction that it is a wrong indication of causality. However, it occurs very often in the field of research and medicine, since doctors and scientists use the correlation theory to find associations and draw up conclusions.


